News
The MUSE-Wide Survey: Survey Description and First Data Release
by Tanya Urrutia on November 19, 2018
New paper by T. Urrutia et al.
This is the first data release paper that describes the MUSE-Wide survey and the contents of this webpage. We describe the survey layout, its scientific goals and the data reduction of the MUSE-Wide data cubes. We then construct two catalogs: one emission line selected and one selected from HST photometry. In the context of redshift surveys, MUSE-Wide shows an incredibly efficient yield of identifications getting higher redshift densities than even the deepest MOS surveys in similar areas.
https://arxiv.org/abs/1811.06549
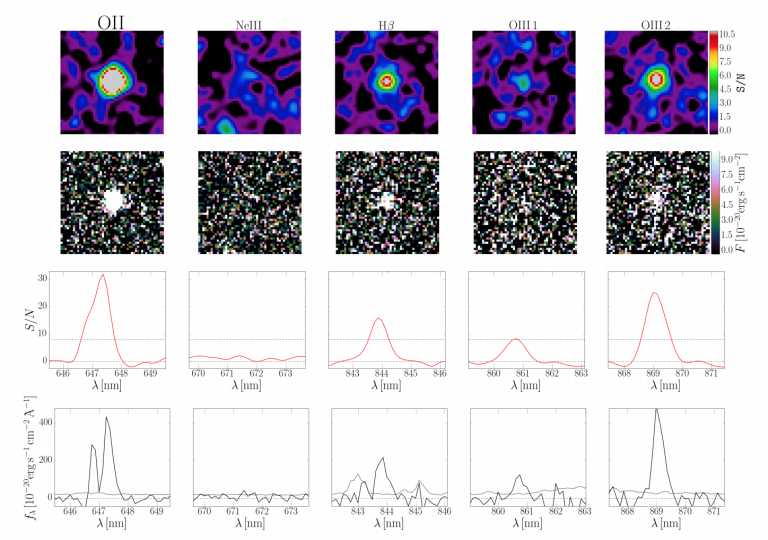
We present the MUSE-Wide survey, a blind, 3D spectroscopic survey in the CANDELS/GOODS-S and CANDELS/COSMOS regions. Each MUSE-Wide pointing has a depth of 1 hour and hence targets more extreme and more luminous objects over 10 times the area of the MUSE-Deep fields (Bacon et al. 2017). The legacy value of MUSE-Wide lies in providing “spectroscopy of everything” without photometric pre-selection. We describe the data reduction, post-processing and PSF characterization of the first 44 CANDELS/GOODS-S MUSE-Wide pointings released with this publication. Using a 3D matched filtering approach we detected 1,602 emission line sources, including 479 Lyman-α (Lya) emitting galaxies with redshifts 2.9≲z≲6.3. We cross-match the emission line sources to existing photometric catalogs, finding almost complete agreement in redshifts and stellar masses for our low redshift (z < 1.5) emitters. At high redshift, we only find ~55% matches to photometric catalogs. We encounter a higher outlier rate and a systematic offset of Δz≃0.2 when comparing our MUSE redshifts with photometric redshifts. Cross-matching the emission line sources with X-ray catalogs from the Chandra Deep Field South, we find 127 matches, including 10 objects with no prior spectroscopic identification. Stacking X-ray images centered on our Lya emitters yielded no signal; the Lya population is not dominated by even low luminosity AGN. A total of 9,205 photometrically selected objects from the CANDELS survey lie in the MUSE-Wide footprint, which we provide optimally extracted 1D spectra of. We are able to determine the spectroscopic redshift of 98% of 772 photometrically selected galaxies brighter than 24th F775W magnitude. All the data in the first data release – datacubes, catalogs, extracted spectra, maps – are available on the website https://musewide.aip.de.
A determination of the Lyman Alpha emitter luminosity function at z=3-6
by Tanya Urrutia on October 11, 2018
New paper by E.C. Herenz et al.
We derive the Lyman Alpha Emitter (LAE) Luminosity Function using the first 24 fields in MUSE-Wide. We use a variety of non-parametric estimators, including the classical 1/Vmax method. When taking into account the extended shape of LAEs into the completeness function, we find steeper slopes in the Luminosity Function than other studies that assume LAEs are point sources.
Available here:
https://arxiv.org/abs/1810.05037
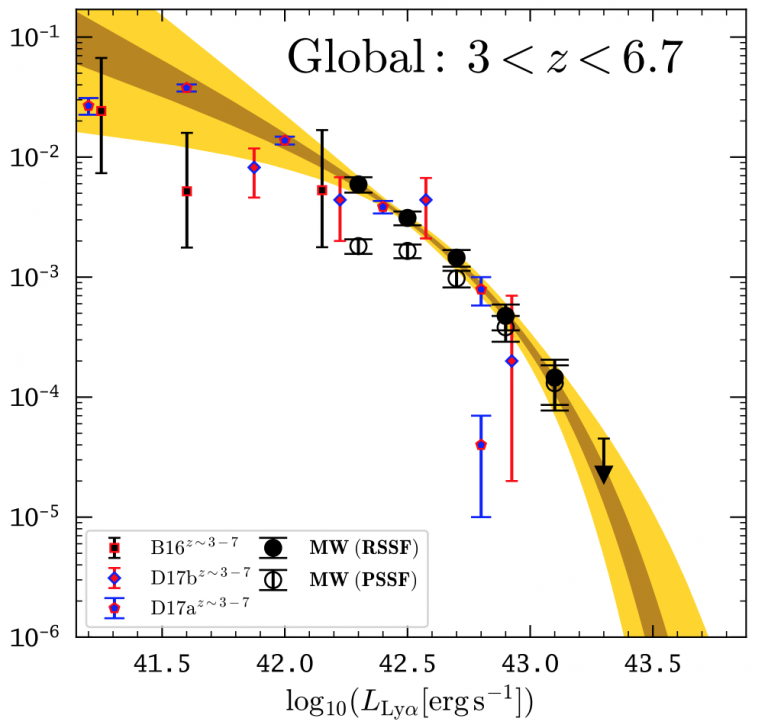
(Abridged) We investigate the Lyman α emitter luminosity function (LAE LF) within the redshift range 2.9≤z≤6 from the first instalment of the blind integral field spectroscopic survey MUSE-Wide. This initial part of the survey probes a region of 22.2 arcmin2 in the CANDELS/GOODS-S field. The dataset provided us with 237 LAEs from which we construct the LAE LF in the luminosity range 42.2≤logLLyα[ergs−1]≤43.5 within a volume of 2.3×10⁵ Mpc3. For the LF construction we utilise three different non-parametric estimators: The classical 1/Vmax method, the C− method, and an improved binned estimator for the differential LF. All three methods deliver consistent results, with the cumulative LAE LF being Φ(logLLyα[ergs−1]=43.5) ≃ 3×10⁻⁶ Mpc−3 and Φ(logLLyα[ergs−1]=42.2) ≃ 2×10⁻³ Mpc−3 towards the bright- and faint-end of our survey, respectively. By employing a non-parametric statistical test, as well as by comparing the full sample to sub-samples in redshift bins, we find no supporting evidence for an evolving LAE LF over the probed redshift and luminosity range. We determine the best-fitting Schechter function parameters α=−1.84+0.42−0.41 and logL∗[ergs−1] = 42.2+0.22−0.16 with the corresponding normalisation logϕ∗[Mpc−3]=−2.71. When correcting for completeness in the LAE LF determinations, we take into account that LAEs exhibit diffuse extended low surface-brightness haloes. We compare the resulting LF to one obtained where we apply a correction assuming compact point-like emission. We find that the standard correction underestimates the LAE LF at the faint end of our survey by a factor of 2.5.
Properties of SF galaxies with high [OIII]/[OII] ratios with MUSE
by Tanya Urrutia on August 14, 2018
New paper by M. Paalvast et al.
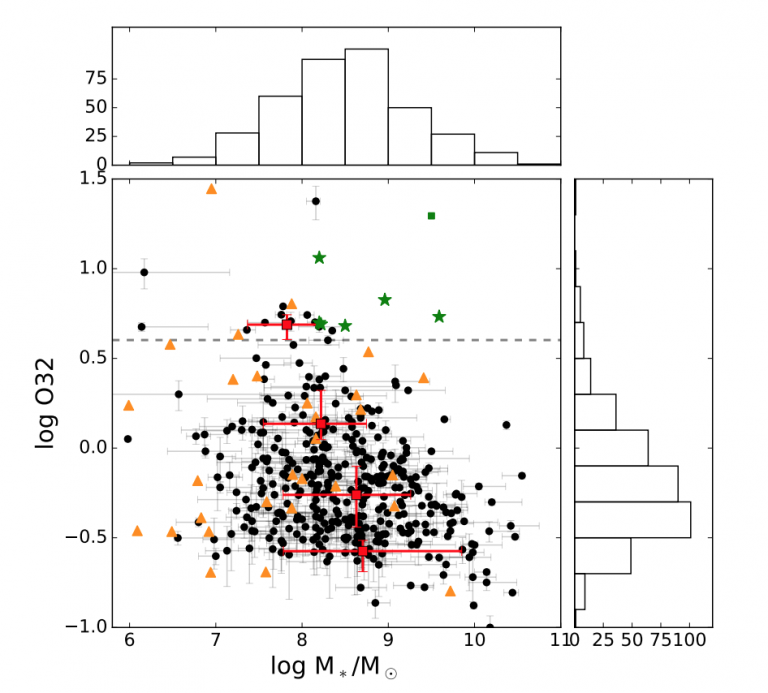
Using data from various MUSE surveys, including MUSE-Wide, we test whether extreme [OIII]/[OII] (O32) emitters have properties, such as star-formation, different from normal, star-forming galaxies. All, but the most extreme O32 emitters’ properties can be explained through very low metallicity models without the need of Lyman Continuum Leakage.
Available here:
https://arxiv.org/abs/1808.04899
We present a study of the [OIII]5007/[OII]3727 (O32) ratios of star-forming
galaxies drawn from MUSE data spanning a redshift range 0.28<z<0.85. Recently
discovered Lyman continuum (LyC) emitters have extremely high oxygen line
ratios: O32>4. Here we aim to understand the properties and the occurrences of
galaxies with such high line ratios. Combining data from several MUSE GTO
programmes, we select a population of star-forming galaxies with bright
emission lines, from which we draw 406 galaxies for our analysis based on their
position in the z-dependent star formation rate (SFR) – stellar mass (M)
plane. Out of this sample 15 are identified as extreme oxygen emitters based on
their O32 ratios (3.7%) and 104 galaxies have O32>1 (26%). Our analysis shows
no significant correlation between M, SFR, and the distance from the SFR-M
relation with O32. We find a decrease in the fraction of galaxies with O32>1
with increasing M, however, this is most likely a result of the relationship
between O32 and metallicity, rather than between O32 and M*. We draw a
comparison sample of local analogues with
A measurement of the Ly α emitting fraction among z > 3 galaxies
by Tanya Urrutia on November 1, 2017
New paper by J. Caruana et al.
Using the data from the first 24 MUSE-Wide fields, we try to find the Lyman Alpha Emitting fraction of relatively UV bright galaxies at redshifts 3 to 6. We find relatively high LAE fractions, which do not evolve over that redshift range, in disagreement with previous studies that found a rise until approx. redshift 6.
Available here:
http://adsabs.harvard.edu/abs/2018MNRAS.473…30C
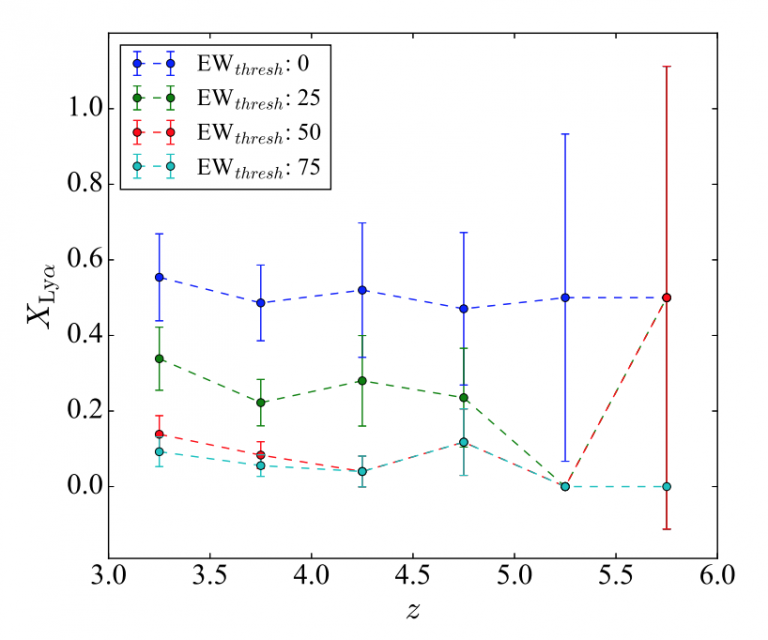
We present a measurement of the fraction of Lyman α (Ly α) emitters (XLy α) amongst HST continuum-selected galaxies at 3 < z < 6 with the Multi-Unit Spectroscopic Explorer (MUSE) on the VLT. Making use of the first 24 MUSE-Wide pointings in GOODS-South, each having an integration time of 1 h, we detect 100 Ly α emitters and find XLy α ≳ 0.5 for most of the redshift range covered, with 29 per cent of the Ly α sample exhibiting rest equivalent widths (rest-EWs) ≤ 15 Å. Adopting a range of rest-EW cuts (0-75 Å), we find no evidence of a dependence of XLy α on either redshift or ultraviolet luminosity.
Detection of a clustering signal from Lyman α emitters in the range 3 < z < 6
by Tanya Urrutia on July 4, 2017
New paper by C. Diener et al.
Using the Lyman Alpha Emitters from the Herenz et al. sample (see previous blog post), we use pair-counts and detect a quite strong clustering signal already in this small 22 arcmin area. The signal is stronger and the correlation length is smaller than predicted by simulations, but within the errors of the survey.
Available here:
http://adsabs.harvard.edu/abs/2017MNRAS.471.3186D
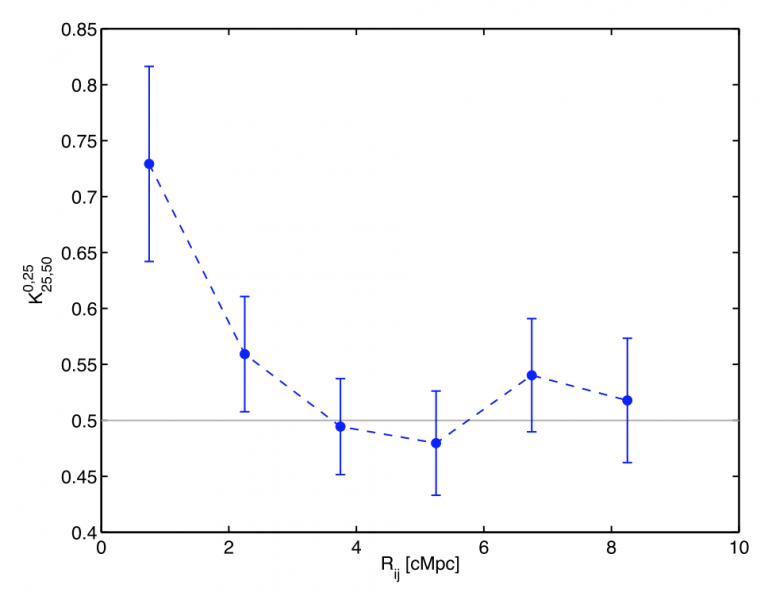
We present a clustering analysis of a sample of 238 Ly α emitters at redshift 3 ≲ z ≲ 6 from the MUSE-Wide survey. This survey mosaics extragalactic legacy fields with 1h MUSE pointings to detect statistically relevant samples of emission line galaxies. We analysed the first year observations from MUSE-Wide making use of the clustering signal in the line-of-sight direction. This method relies on comparing pair-counts at close redshifts for a fixed transverse distance and thus exploits the full potential of the redshift range covered by our sample. A clear clustering signal with a correlation length of r0=2.9^{+1.0}_{-1.1} Mpc (comoving) is detected. Whilst this result is based on only about a quarter of the full survey size, it already shows the immense potential of MUSE for efficiently observing and studying the clustering of Ly α emitters.
A first catalogue of 831 emission line galaxies
by Tanya Urrutia on May 20, 2017
New paper by E.C. Herenz et al.
We search for emission-line galaxies using a matched filtering approach (LSDCat). In the first 24 MUSE-Wide fields, we find 831 of these galaxies, including 237 Lyman Alpha emitters.
Available here:
http://adsabs.harvard.edu/abs/2017A%26A…606A..12H
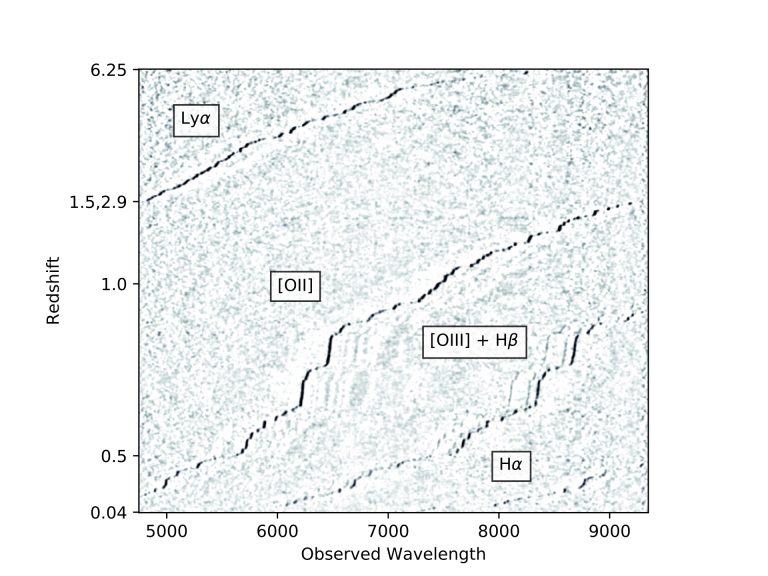
We present a first instalment of the MUSE-Wide survey, covering an area of 22.2 arcmin2 (corresponding to 20% of the final survey) in the CANDELS/Deep area of the Chandra Deep Field South. We use the MUSE integral field spectrograph at the ESO VLT to conduct a full-area spectroscopic mapping at a depth of 1 h exposure time per 1 arcmin2 pointing. We searched for compact emission line objects using our newly developed LSDCat software based on a 3D matched filtering approach, followed by interactive classification and redshift measurement of the sources. Our catalogue contains 831 distinct emission line galaxies with redshifts ranging from 0.04 to 6. Roughly one third (237) of the emission line sources are Lyman α emitting galaxies with 3 < z < 6, only four of which had previously measured spectroscopic redshifts. At lower redshifts 351 galaxies are detected primarily by their [O II] emission line (0.3 ≲ z ≲ 1.5), 189 by their [O III] line (0.21 ≲ z ≲ 0.85), and 46 by their Hα line (0.04 ≲ z ≲ 0.42). Comparing our spectroscopic redshifts to photometric redshift estimates from the literature, we find excellent agreement for z < 1.5 with a median Δz of only 4 × 10⁻⁴ and an outlier rate of 6%, however a significant systematic offset of Δz = 0.26 and an outlier rate of 23% for Lyα emitters at z > 3. Together with the catalogue we also release 1D PSF-weighted extracted spectra and small 3D datacubes centred on each of the 831 sources.