Quality control for
Basic parameters - individual exposures
| Exp-no | Date | Seeing | Airmass |
|---|---|---|---|
| 1 | Feb. 3, 2016, 12:58 a.m. | 0.848 | 1.073 |
| 2 | Feb. 3, 2016, 1:15 a.m. | 0.805 | 1.104 |
| 3 | Feb. 3, 2016, 1:32 a.m. | 0.762 | 1.141 |
| 4 | Feb. 3, 2016, 1:49 a.m. | 0.835 | 1.186 |
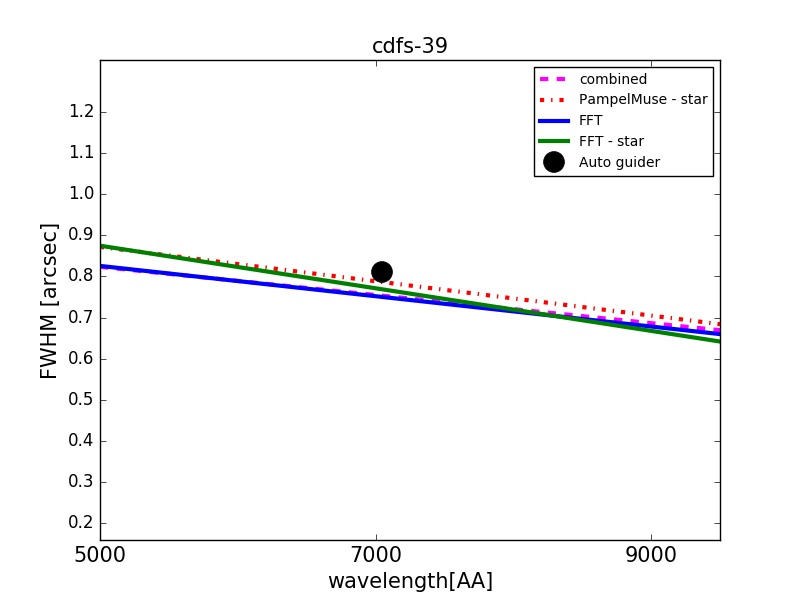
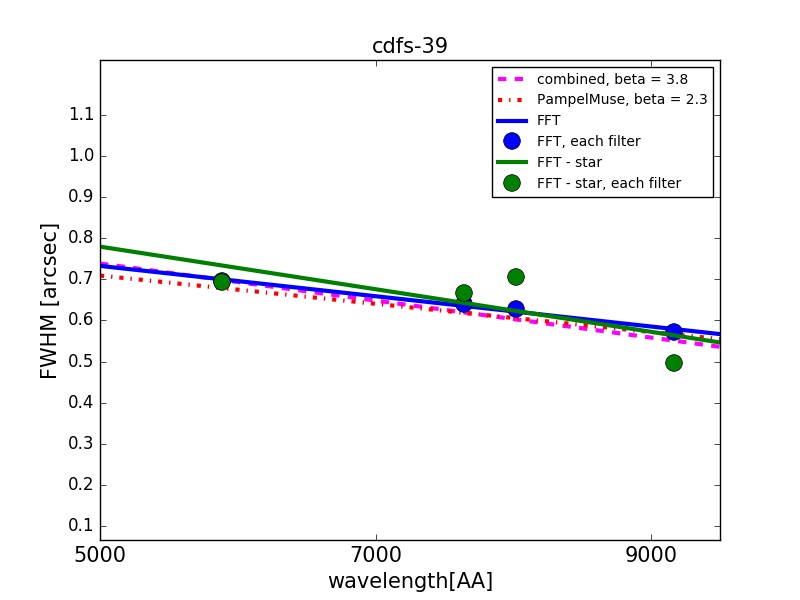
PSF
PSF values, Gaussian fit
| p0 | 0.753 |
| p1 | -0.00003415 |
| Method | combined fitting |
Gauss
Moffat
Noise characteristics
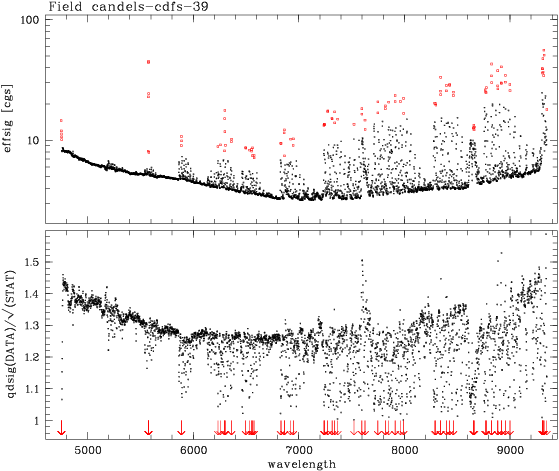
Click here to download noise-values as FITS file.
Sky brightness
Sky spectrum and sky brightness
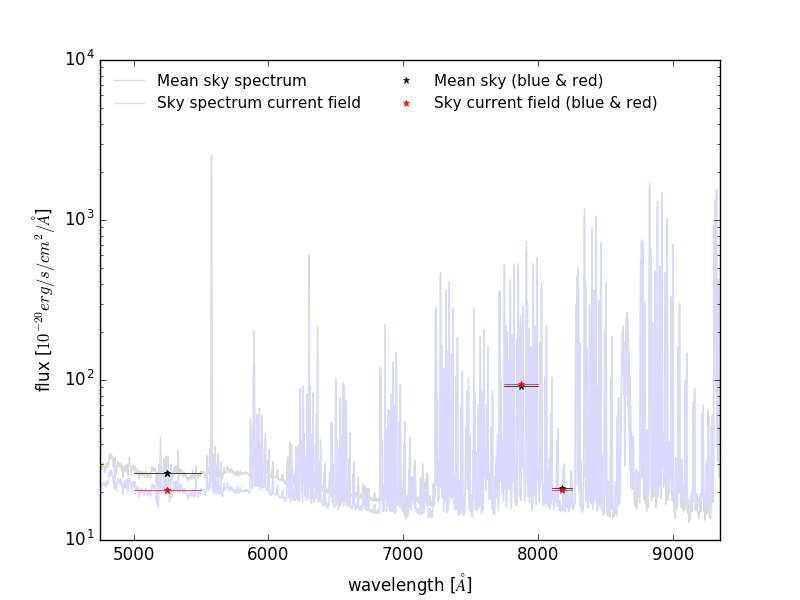
Numerical values
| Blue, 5000-5500 | 10248.0 [10^(-20)erg/s/cm^2/Å] |
| Red, 7750-8000 | 23044.0 [10^(-20)erg/s/cm^2/Å] |
| Red, 8100-8250 | 2987.0 [10^(-20)erg/s/cm^2/Å] |
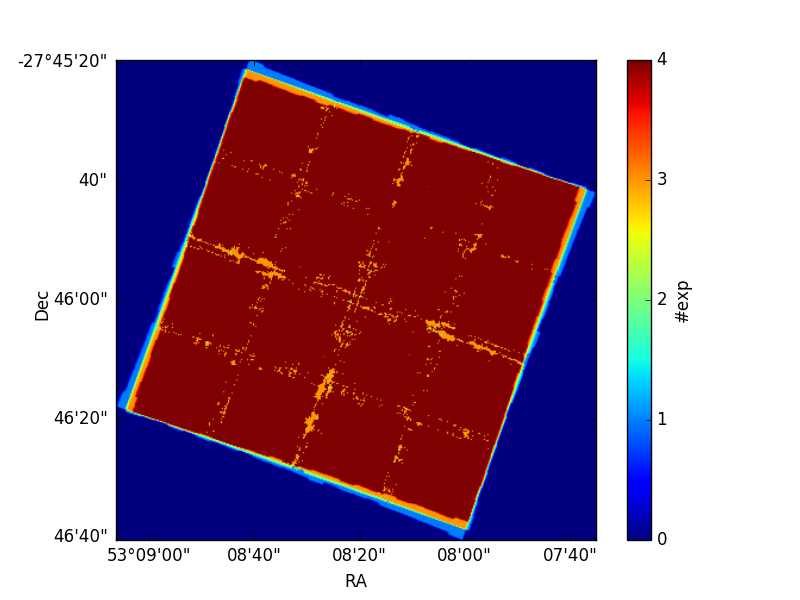
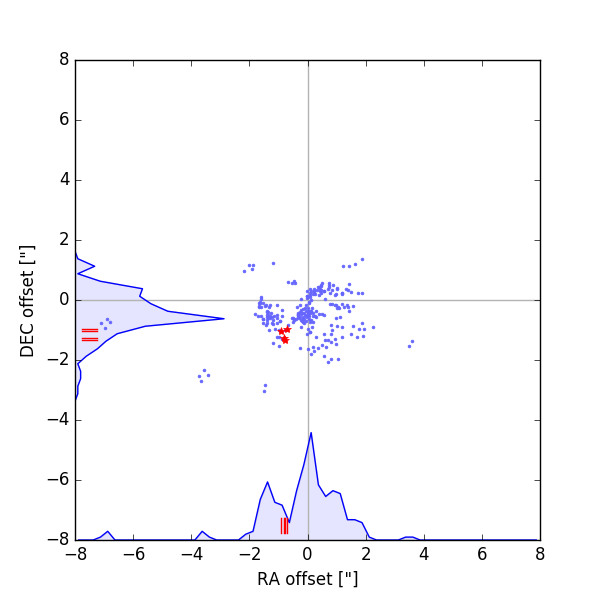
WCS offsets
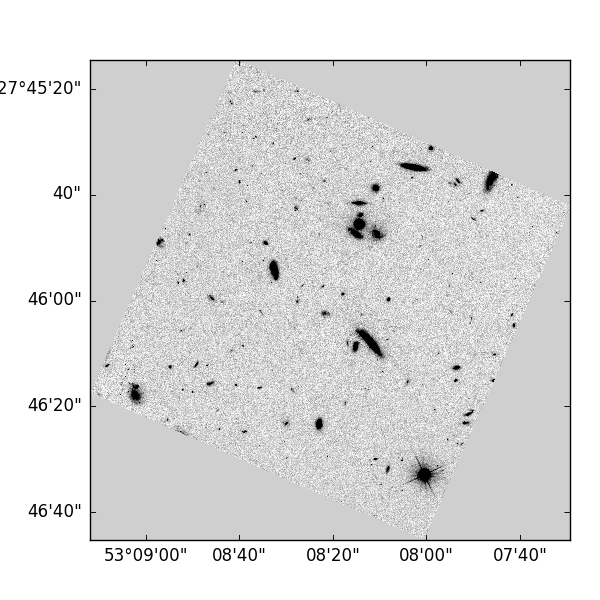
Exposure map
WCS offset w.r.t HST
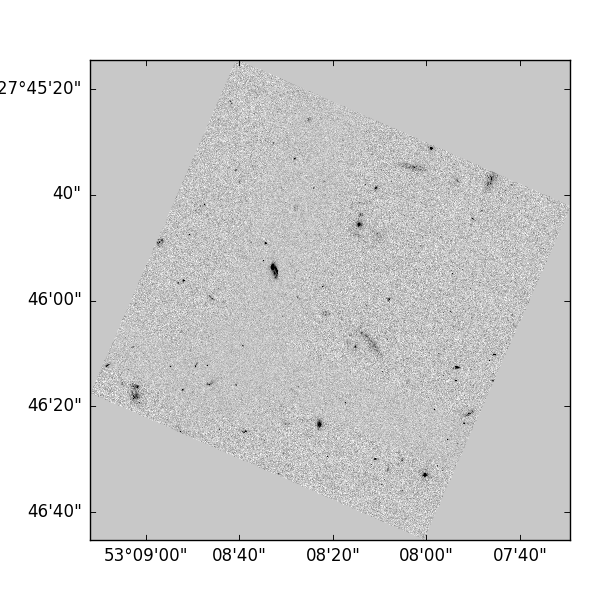
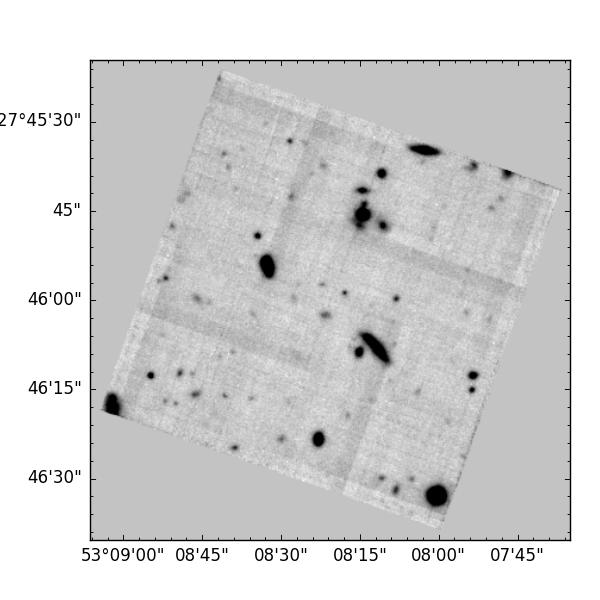
HST vs MUSE images
Filter 435w
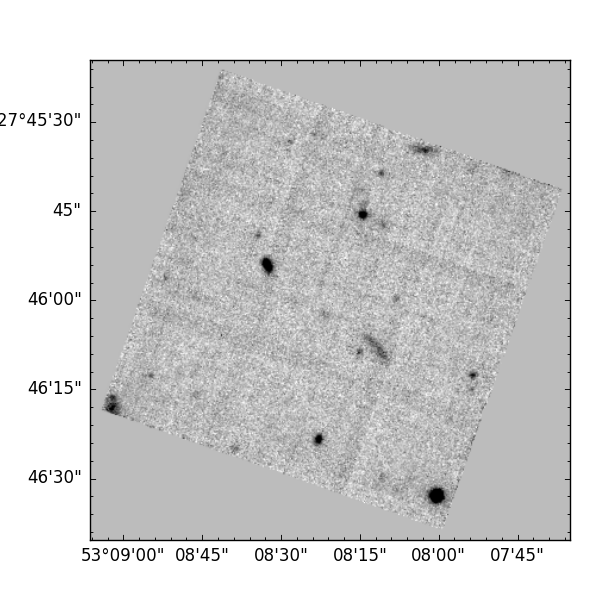
Filter 606w
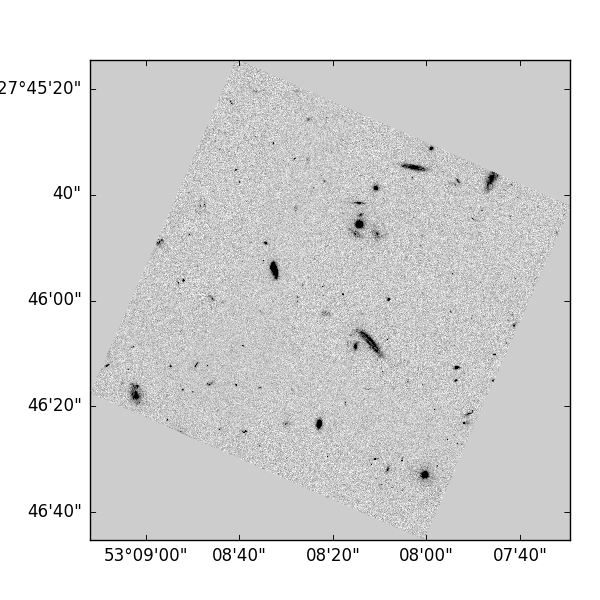
Filter 775w
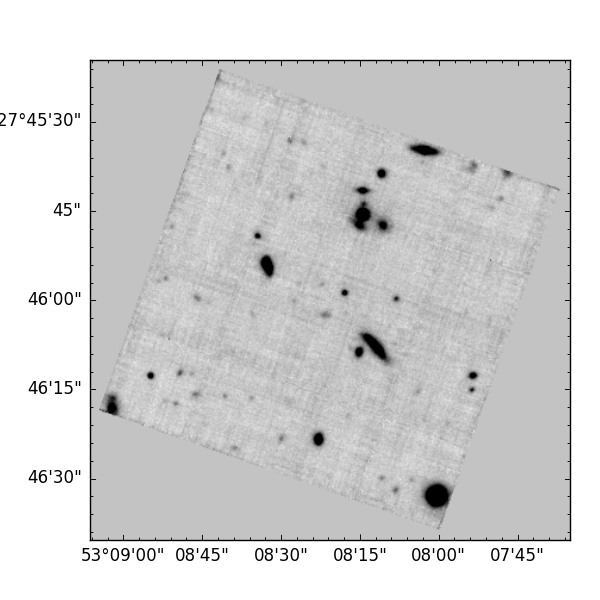
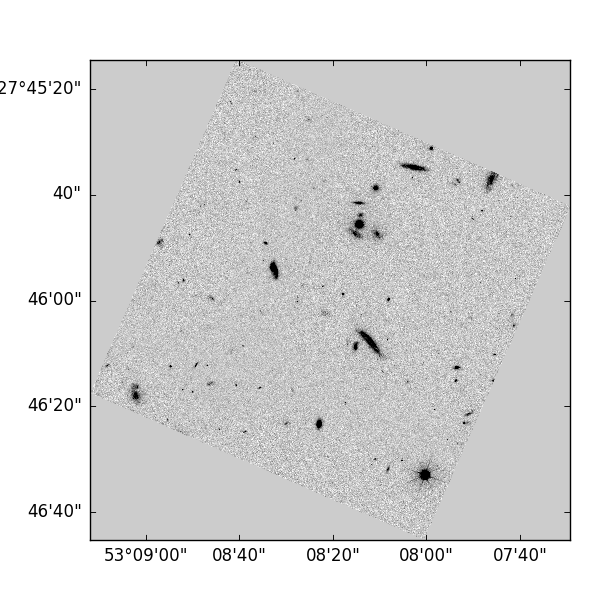
Filter 814w